
One of the problems most frequently encountered by new users of Speak Freely is correctly setting audio input and output levels. If the microphone input level is set to zero, for example, you may be able to hear others but, when you transmit, all you'll be sending is silence. Conversely, if the wave audio output level on your sound card is set to zero, audio you receive will vanish in silence because the volume control is turned all the way down.
Compounding the difficulty of properly setting audio input and output levels is the fact that the utilities involved are typically provided by the sound card's manufacturer and specific to it, and consequently vary from machine to machine. Even the terminology differs among vendors, one referring to a "volume control" while another dubbing theirs a "multimedia mixer". Marketing....
Speak Freely's Audio Monitor panel displays audio input and output levels in real time, allowing you to observe what Speak Freely is receiving from your microphone and sending to your speakers. In conjunction with your sound card's gain setting utility (whatever it's called), this should help you set the levels so things work acceptably.
The Audio Monitor panel is displayed by selecting the Help/Audio Monitor menu item. The Audio Monitor is a free-floating window and may be positioned anywhere on the screen; it is not confined to the Speak Freely application frame. The Envelope frame at the bottom shows the average energy level of successive packets of 512 audio samples (64 milliseconds each at 8000 samples per second). The maximum dynamic range of your audio card is represented by an envelope display which fills the vertical extent of the frame; if you see this happening, your input level is set too high and the sound card will "clip" audio, resulting in terrible distortion, especially when using aggressive compression algorithms such as LPC and LPC-10. If the envelope remains a single line or barely changes when you speak into the microphone at a normal level, the input gain is set too low or, perhaps, your sound card is set for input from a line-in source (such as an audio CD player) as opposed to the microphone.
The envelope frame shows input from the microphone (in other words, audio you transmit) in green and output to the speaker (audio you receive) in blue. If you wish to monitor only input or output, check the appropriate box in the "Monitor" box to the left. As audio is transmitted and received, a white cursor shows the current position in the Envelope display; when the right of the frame is reached, the cursor returns to the left, overwriting the earlier envelope. You can monitor either the average (root-mean-square: RMS) or maximum (peak) intensity of audio by checking the corresponding item in the "Envelope" box. Regardless of the envelope display selected, any packet which contains one or more samples which were "clipped" due to exceeding the dynamic range of the audio hardware will be flagged by a red border in the envelope display. To avoid clipping, reduce audio input gain or simply hold the microphone further from your mouth.
The Spectrum frame at the top shows the frequency spectrum of audio input and output (whichever or both, as selected by the "Monitor" box). The default display is a real-time monitor similar to that on graphic equalisers; the height of the individual bars represent the audio energy in each frequency band, with lower frequencies to the left and higher frequencies to the right. The spectrum is updated only while audio is being transmitted or received. The frequency scale is linear, with 20 Hz at the left at 2 kHz at the right; almost all of the energy of human speech falls within this frequency band.
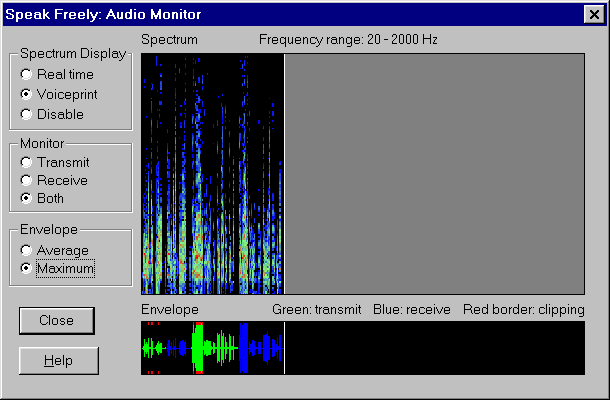
When "Voiceprint" is checked in the "Spectrum Display" box, the real-time frequency display is replaced by a spectrum plot which advances from left to right along with the envelope. For each interval in time, the Envelope gives the total instantaneous energy and the Spectrum its breakdown by frequency. In this case the vertical axis in the Spectrum frame ranges from 20 Hz to 2 kHz, with the colour indicating the (logarithmic) intensity of each of the 128 frequency bands plotted.
Calculating the spectrum is computationally intense. (If you're into details, it requires performing about sixteen 512 point complex fast Fourier transforms per second.) If your computer isn't fast enough to do this while simultaneously executing the compression and encryption modes you've chosen, displaying the Audio Monitor may result in break-ups or lost audio. If this happens, check "Disable" in the "Spectrum Display" box to suppress computation and display of the spectrum; you'll still be able to use the Envelope frame (which takes negligible overhead to update) to monitor input and output levels.