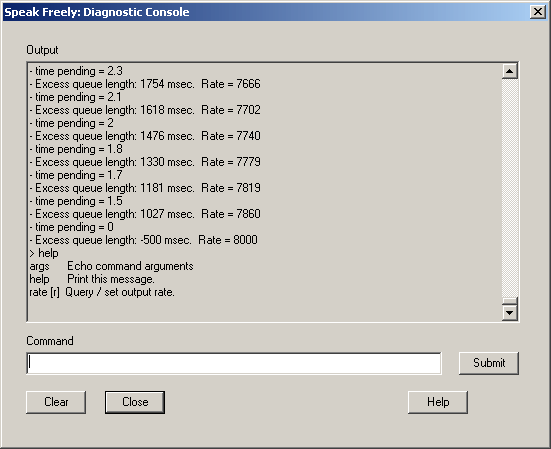
The diagnostic console provides a mechanism which permits Speak Freely developers to easily add diagnostic output for various aspects of the program and implement interactive diagnostic facilities without all the complexity of a full-fledged Windows graphical interface. The diagnostic console works like a command-line window, displaying output which scrolls on a line by line basis and permitting the entry of diagnostic commands. To display the console, select the Help/Diagnostic Console menu item.
The output sent to the diagnostic console tends to be ephemeral in nature; it generally reflects recently-added capabilities where remote diagnosis may be required, with console output being removed as features are judged stable. Likewise, the diagnostic commands available change as features pass from active development to maturity. You can always obtain a list of the current diagnostic commands by entering the help command. For details about the various commands and their arguments, as well as a description of messages you may see displayed in the diagnostic console, please refer to the Speak Freely Development Log.
	void consoleLog(char *text);
	void cPrintf(LPCSTR lpFormat, ...);
	void vcPrintf(LPCSTR lpFormat, va_list arglist);
consoleLog() writes its argument text string to the console, while cPrintf() and vcPrintf() format data identically to printf(), taking a variable argument list or va_list respectively. Note that when the diagnostic console is not displayed, these functions have essentially zero overhead, so you needn't feel guilty calling them in frequently executed code.
To add a new diagnostic command, add a branch to the command processing logic in consoleProcessCommand() in Console.c, and be sure to add a brief description of your command to the help text in consoleHelp().